How to create a salesboard?
Create a salesboard
- Filters (see previous guide)
- The View
- The board
2. The view

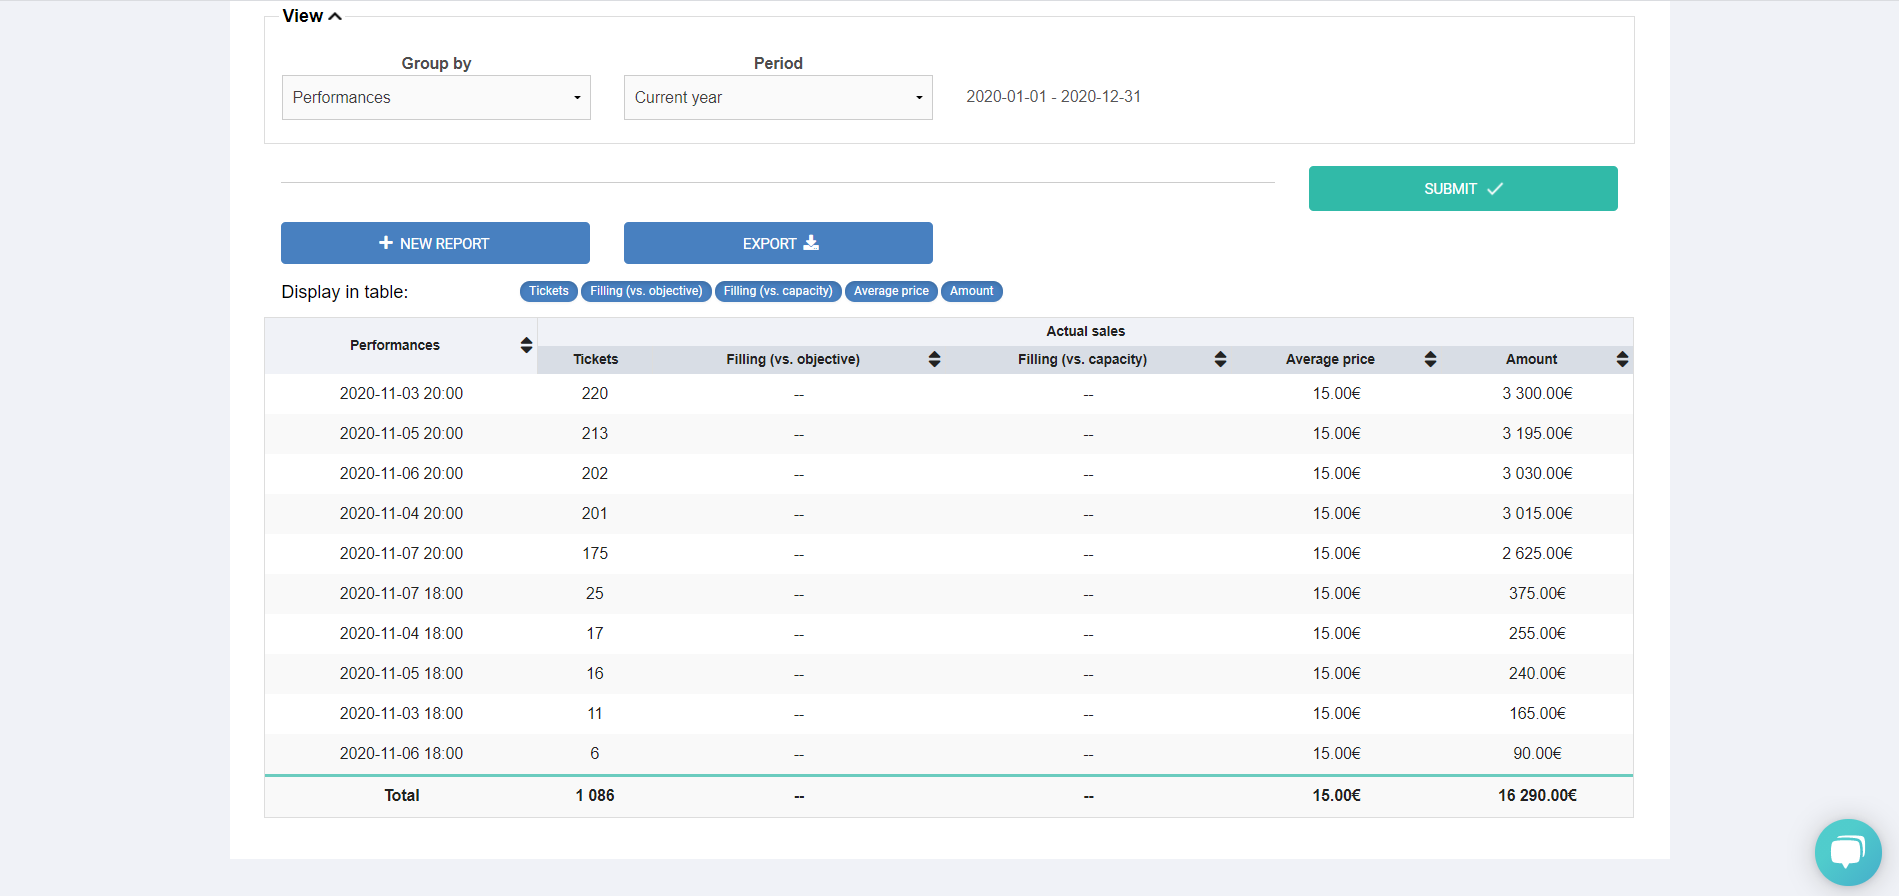
On this page, the "View" section allows you to determine the data you wish to analyse in the salesboard. The "Group by" function will allow you to define the items displayed in the left column of your table. You then have the choice between the following elements:
Tickets
Type of event : Allows you to compare sales by the type of event you have previously defined.
Venue : If you are giving performances in several different venues, this will allow you, for example, to determine the venue that attracts the largest audience.
Event : This report is very useful throughout the season, as it allows you to find out in just a few clicks the number of tickets sold, the amount realized and the average price for each of your events.
Performance : If you have several performances for an event, this will allow you to have the details for each performance. To do this, select your event in the Filters section and then "group by" the performance in the View section.
Sales channel : This function allows you to know the distribution of sales by sales channel.
Type of category : This allows you to know the distribution by type of category if you have predefined them.
Category : If you have several categories in your room, you will be able to determine the category that brings you the most sales or those that need more support from your marketing teams.
Type of pricing formula : This allows you to see the breakdown by type of pricing formula if you have predefined them.
Price formula : Similarly, if you have several price formulas, this allows you to simply know the price formula for which you have sold the most tickets.
Ticket Status : This feature allows you to see the breakdown of tickets sold, reserved, cancelled or refunded.
Period
Sale dates : Depending on the filters defined beforehand, this parameter allows you to determine the number of tickets sold and the amount realised day by day over the determined period.
Time : "Group by" time allows you to see what time of day you sell the most tickets over the specified period.
Day of the week : In the same way, "Group by" day of the week allows you to determine the number of tickets sold for each day of the week over the chosen period.
Week : "Group by" week allows you to add up the number of tickets sold for each week of the year, week 1 corresponding to the first week of January.
Month : In the same way, "Group by" month allows you to add up the number of tickets sold for each month of the year.
Year : "Group by" year allows you to add up the number of tickets sold per calendar year.
As with the " Charts " section, the period allows you to determine the period over which you wish to carry out your analyses.
Once all these parameters have been defined, don't forget to click on the " Submit " button to display the board! We also invite you to explore all the possibilities to find interesting data to exploit.
3. The board

There are six different columns in the table: the first column which is defined by the field selected in the "Group by" above, the number of tickets, the filling (vs. objective), the filling (vs. capacity), the average price and the total amount.
You have the choice to display or not to display certain columns. To do this, simply click on the buttons next to "See in table" to select or deselect the columns of your choice.
You can also sort the data in the table in alphabetical order, ascending or descending. To do this, simply click on the arrows to the right of the column names to determine the order.