1. How to control your Overview?
Loyalty is at the core of the Arenametrix experience, and the Engagement Pyramid clearly reflects this. Contacts are distributed across 5 engagement levels based on their loyalty and spending.
When you click on one of the pyramid bars, all the blocks adjust their statistics and colors according to the selected engagement community. The pyramid bars act as filters, allowing you to refine your understanding of each engagement community.
The Overview is updated every morning around 9 a.m. Each day therefore corresponds to a new dataset. The date of the last update is displayed at the bottom of the page.
Two variables allow you to analyze this data over time:
-
Instant T: This corresponds to the reference date of the displayed data. By default, it is set to the current day, but you can select a past date to view the Overview as it appeared at that moment.
-
Instant T-1: This allows you to select a second comparison date. The evolution indicators then display the differences between the data at Instant T and those at Instant T-1.
The Overview contains two types of data:
-
Simple data: the value of an indicator at Instant T.
-
Cumulative data: events recorded during the 3 months preceding Instant T. This period is fixed to ensure consistent data comparison.
2. Block-by-block overview of the Overview page
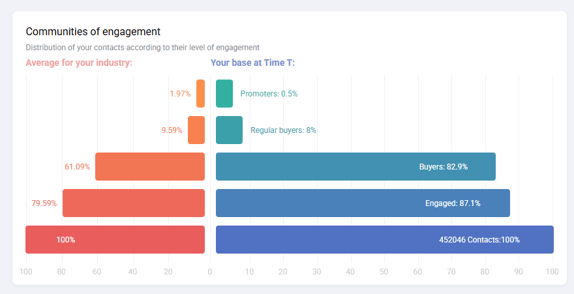
The Engagement communities block shows how your contacts are distributed across the different communities. It is a cumulative pyramid, meaning that all Regular buyers are also Buyers, and so on. The pyramid has two sides that allow you to compare your results with your sector.
-
The right side of the pyramid, ranging from blue to green, represents your audiences and gives you a clear view of your engagement communities. The bars are clickable and can be used as filters.
-
The left side of the pyramid, ranging from red to orange, displays the statistics of your reference sector as defined in your settings. These figures are derived from our anonymized client databases.
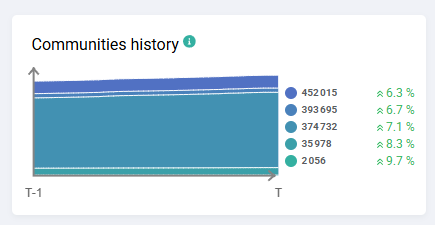
The Communities history block allows you to track the evolution of your engagement communities over time. The chart only displays the communities selected in the pyramid, allowing you to analyze them in detail, even when they represent less than 5%. By hovering over the curves, you can see the data details for each date.
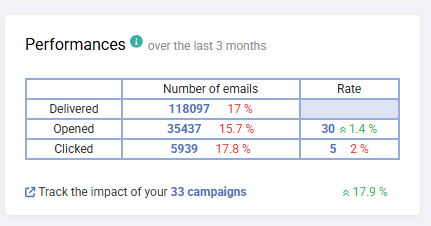
The Performance block shows the performance of your marketing campaigns over the past 3 months, as well as their evolution compared to the previous period. Evolution is always displayed as a percentage. For example, if there is a 10% increase on a rate of 22%, this means the rate was 20% three months earlier, not 12%.
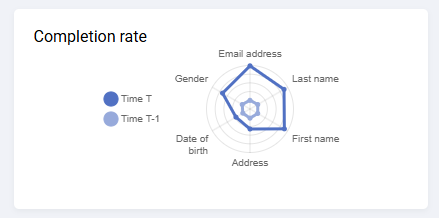
The Completion rate block allows you to monitor the level of data qualification of your contacts at Instant T and Instant T-1. The radar chart does not display values from 0 to 100%, but from the lowest recorded rate to the highest.
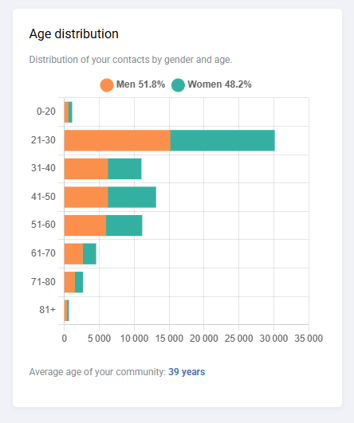
The Age distribution block shows the structure of your communities by gender and age, allowing you to identify which generation they belong to and better understand their potential expectations. However, the relevance of this chart depends on the quality of your data.
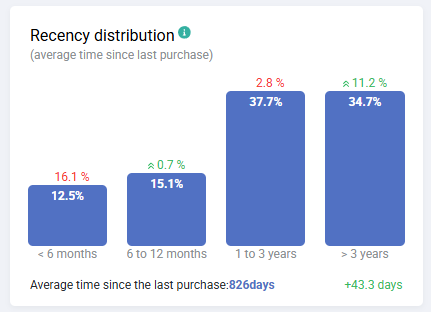
The Recency distribution block is based on the average number of days since the last purchase. This allows you to observe the attendance habits of your contacts.
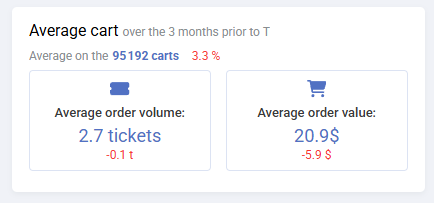
The Average cart block displays three key metrics: the number of baskets over the past 3 months, as well as the Volume and Value of your contacts’ baskets.
The Volume indicates the number of products per purchase, while the Value represents the average spending per purchase.
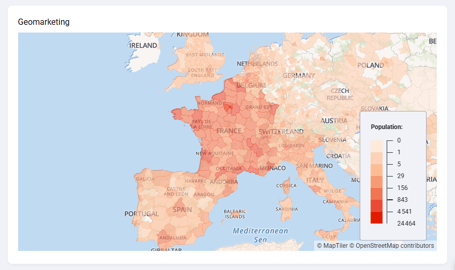
The Geomarketing block allows you to quickly visualize the geographic distribution of your contacts and estimate your catchment areas in order to launch geolocated campaigns. The segmentation follows the NUTS3 standard (“Nomenclature of Territorial Units for Statistics level 3”), which corresponds to departments in France.